
by Denise Olivares-Molina | Aug 17, 2026 | Advice for Homeowners, Advice for Sellers, For Sellers, Home Prices, Home Selling Strategy, Homeowner Information, Housing Market, Housing Market Insights, Real Estate Finances, Real Estate Investing, Real Estate Market, Real Estate Market 2026, Real Estate Tips, Real Estate Trends in 2026
That spare room on the main floor. The finished basement with a kitchenette and its own entrance. The bonus room you’ve been using for storage.
To you, it’s extra space. But to a growing pool of buyers, it’s the reason they’d pick your house. Here’s why. Multi-generational homebuying is on the rise.
Millions of Families Are Living Multi-Generationally
The number of multi-generational households is climbing. That’s when 3 or more generations live under one roof. And data shows those households grew from 3.2 million to almost 4 million between 2014 and 2024, according to Realtor.com.
And each year, more people are shopping for a larger home that fits their combined needs.
While the appetite for this type of house is rising across the board, data from USAFacts shows multi-generational living is more common in some states than others. The darker the state in the map below, the more common it is in that area (see map below):
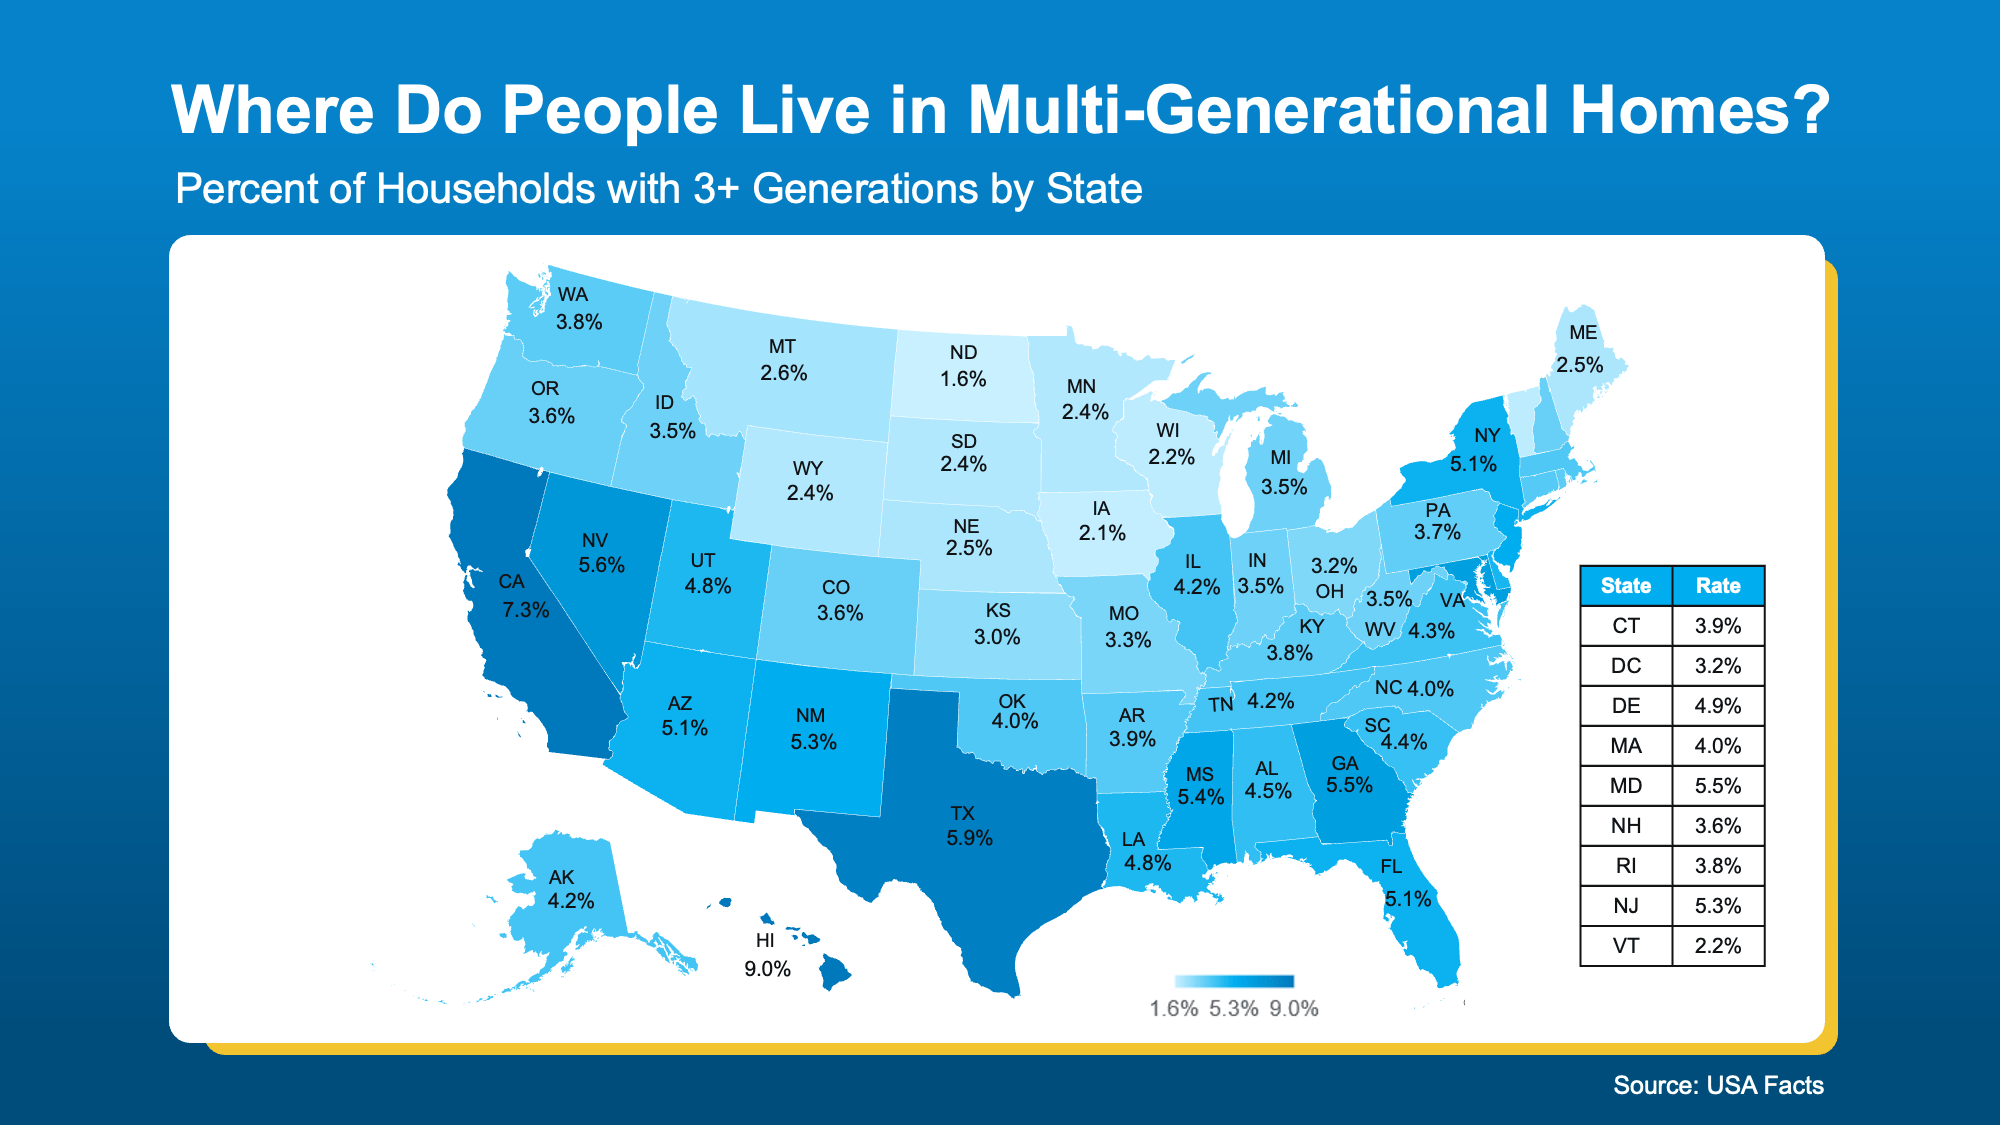
Where does your state fall? Depending on where you are, the pool of buyers looking for a house like yours could be even bigger than you’d think. But the overall bottom line is this.
There’s a real market out there for larger homes with room for multiple generations under one roof, especially since affordability is still so tight. And if you own a house like that, it’s in demand.
Multi-Generational Houses Sell at a Premium
And that extra room carries real value with the right buyer. According to Realtor.com, in 2025 the median asking price for a multi-generational house was $709,000 – roughly 65% higher than the $429,900 median for a standard house.
Some of that is simply size. But compare multi-generational homes to regular homes with the same amount of square footage, and they still come out on top – $262 per square foot versus $215.
That’s a 22% premium you could command for special features like in-law suites, second kitchens, and separate entries (see graph below):
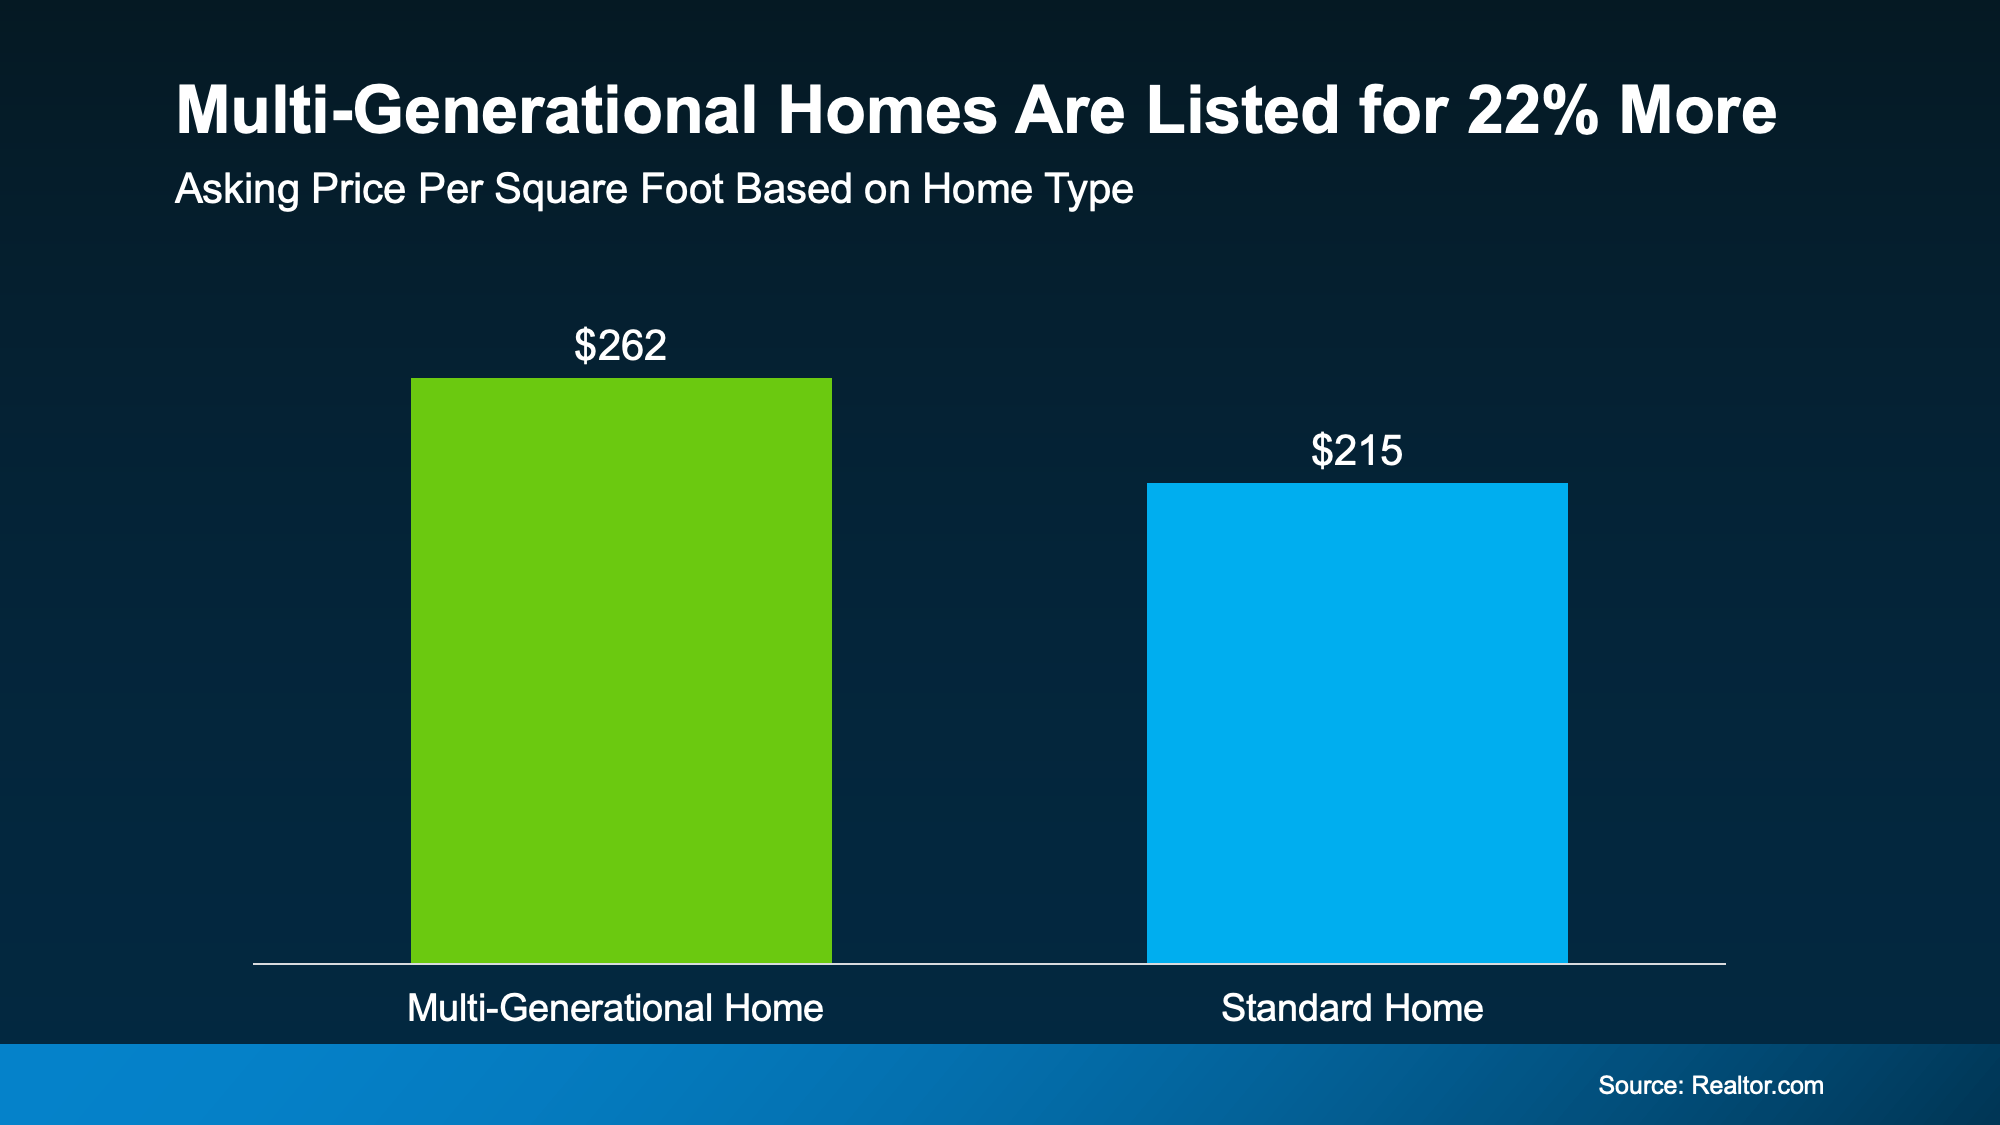
When you sell, this could help you walk away with more money in your pocket, especially when your agent highlights your home’s multi-generational-friendly features in your listing.
And Buyers Aren’t Getting Sticker Shock
And even with slightly higher price tags, buyers aren’t flinching. Multi-generational houses drew 13.5% more online views than standard ones, and they still sold just as fast – in about 59 days – per the same Realtor.com report.
Hannah Jones, Senior Economic Research Analyst at Realtor.com, explains:
“The strong demand and steep premiums we are seeing in inventory-constrained markets point to a real mismatch between what buyers are looking for and what is actually available. For sellers in these markets, this type of home can be a significant asset.”
Basically, when buyers want something that’s very specific, the house that checks the box tends to stand out.
Bottom Line
Your multi-generational-friendly, or simply larger-than-average, house might meet criteria a lot of buyers can’t find in a standard one. That’s what gets attention. And offers. So, let’s chat about what it could get you in our market right now.
Thank You For Reading
Denise Olivares-Molina

by Denise Olivares-Molina | Aug 17, 2026 | Advice for Buyers, Buyers, First Time Home Buyers, First-Time Buyers, First-Time Investors, For Buyers, Market Trends, Market Updates, Real Estate Finances, Real Estate Goals, Real Estate Investing, Real Estate Market, Real Estate Market 2026, Real Estate Tips, Real Estate Trends in 2026, Weekly
Pregunte por ahí y casi todos los compradores de viviendas quieren saber si hay alguna manera de conseguir una mejor oferta. Y casi todos los vendedores quieren saber si todavía obtendrán el precio máximo por su propiedad.
Lo interesante es que… ambos pueden tener razón exactamente al mismo tiempo. Todo depende de dónde viva.
Eso se debe a que el mercado inmobiliario actual ya no se mueve en una sola dirección. Algunos mercados favorecen claramente a los compradores. Otros todavía favorecen a los vendedores. Pero la mayoría se encuentra en un punto intermedio.
Y saber en qué mercado se encuentra realmente puede cambiar por completo la estrategia que utilice para comprar o vender (y qué expectativas debería tener). Vamos a desglosarlo.
Un número le dice quién tiene el poder de negociación
Entonces, ¿cómo sabe en qué mercado se encuentra? Hay un número que cuenta la historia más rápido que cualquier otra cosa: los meses de inventario de viviendas en venta. Es la señal más clara de quién tiene la ventaja y qué estrategia necesitará. Piénselo de esta manera.
Imagine que a partir de hoy no se pusieran a la venta más casas. Los meses de inventario nos dicen cuánto tiempo tomaría vender todo lo que está actualmente en el mercado según la demanda de hoy.
En términos generales, si los meses de inventario son:
-
Menos de 4 meses: Los vendedores suelen tener la ventaja.
-
De 4 a 6 meses: Compradores y vendedores están en mayor igualdad de condiciones.
-
Más de 6 meses: Los compradores generalmente pueden negociar una mejor oferta.
En este momento, los datos de la Asociación Nacional de Agentes Inmobiliarios (NAR, por sus siglas en inglés) indican que ese número es de 4.6, lo que sitúa al mercado general nuevamente en territorio equilibrado (vea el gráfico a continuación):
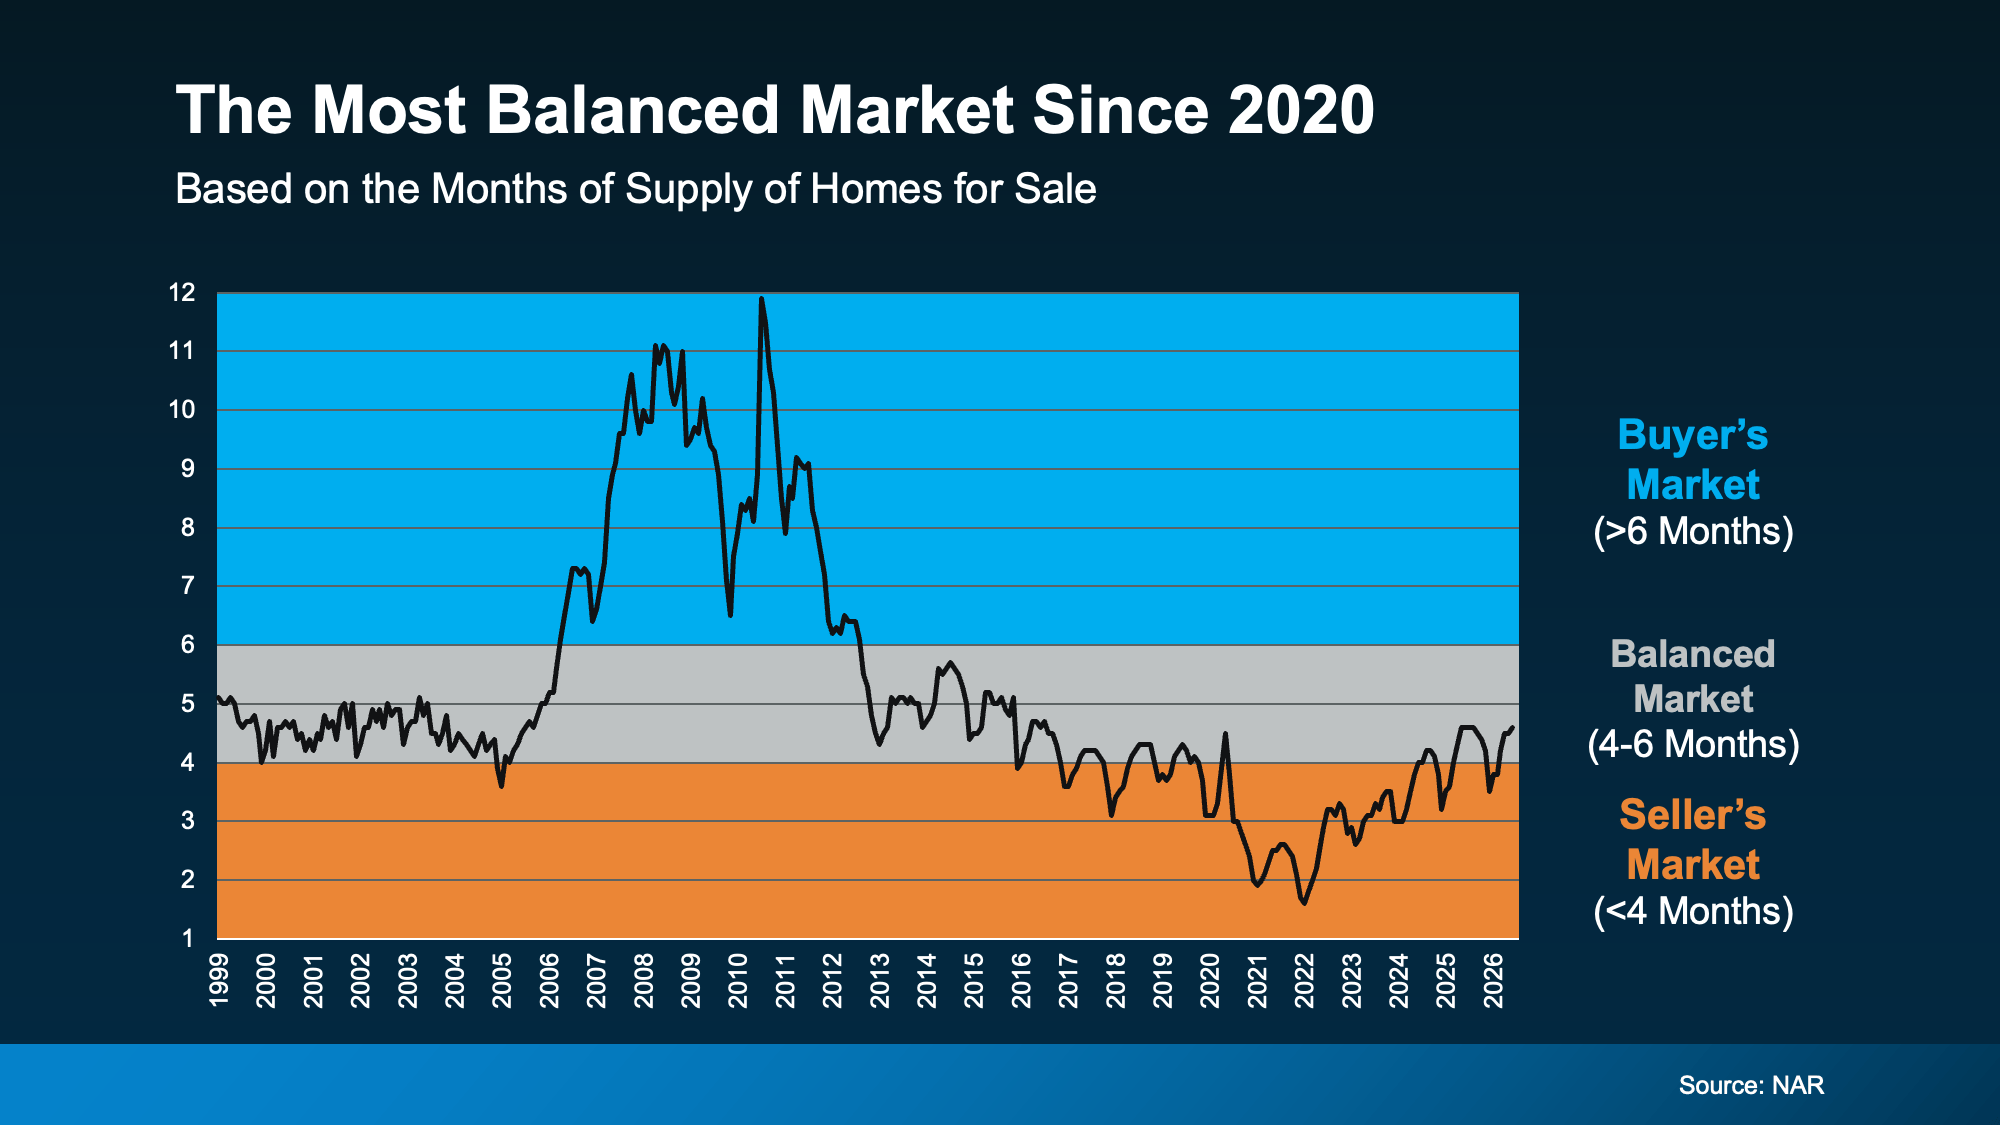
Eso significa que, en su conjunto, el mercado finalmente ha regresado a un rango mucho más equilibrado después de años de estar inclinado a favor de los vendedores. Aunque pueda parecer que la balanza se ha inclinado solo un poco, es suficiente para hacer una verdadera diferencia en la estrategia que necesitará para su mudanza, al menos en la mayoría de los lugares.
La historia de dos mercados: Por qué “equilibrado” no significa lo mismo en todas partes
Los datos de Redfin ayudan a arrojar luz sobre cómo se distribuye esto en todo el país. Desglosa qué ciudades se inclinan en una dirección u otra (vea el gráfico a continuación).
-
Algunos mercados dan a los compradores más poder de negociación. Esos están en azul.
-
Algunos todavía favorecen a los vendedores. Ese es el naranja.
-
Otros se encuentran en un punto intermedio. Esos son grises.
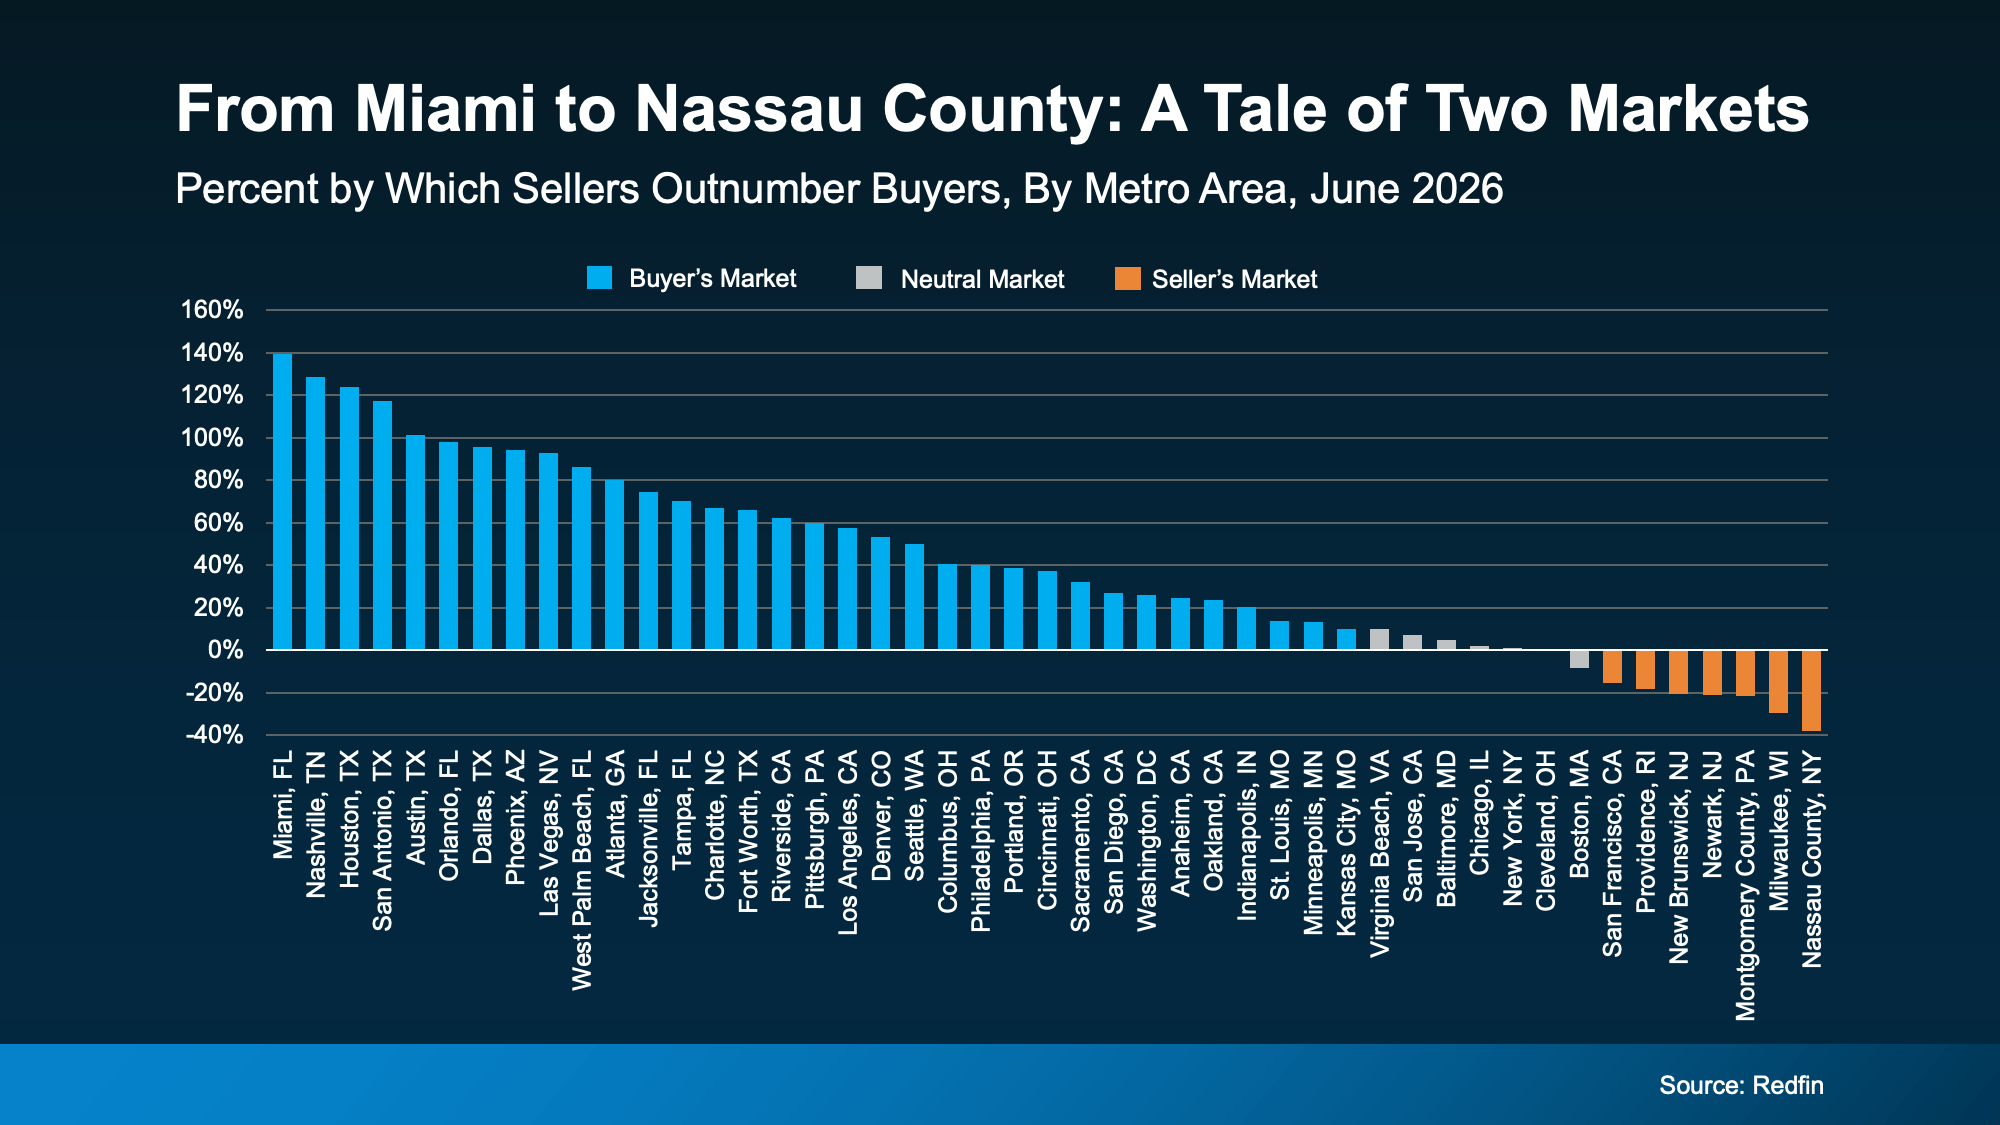
¿Nota algo? Muchos más lugares están experimentando condiciones más favorables para los compradores en este momento. De hecho, este es el mercado más favorable para los compradores que hemos visto en casi 6 años.
Pero no asuma que los compradores tienen la ventaja en todas partes.
Todavía hay ciudades donde los vendedores mantienen el poder. Y si se encuentra en una de ellas, su enfoque para vender o comprar se verá completamente diferente al que tendría en un mercado que se inclina hacia los compradores.
El mayor error que puede cometer en este momento
Por eso, el mayor error no es pensar que finalmente es un mercado de compradores. Y tampoco es pensar que sigue siendo un mercado de vendedores. Es hacer cualquier suposición sin hablar primero con un agente experto.
El mercado actual es increíblemente local. En un mercado, un comprador podría estar obteniendo miles de dólares en concesiones por parte de un vendedor. Y un propietario podría tener que considerar bajar su precio.
Pero en otro, un comprador podría estar estresado por tener que presentar su mejor oferta, o podría perder la casa frente a otro comprador. Y un vendedor podría seguir viendo una fuerte demanda y precios subiendo poco a poco.
El mismo mercado inmobiliario general.
Experiencias muy diferentes.
La verdad es que lo que está sucediendo en su propio vecindario afecta todo, desde cómo ponerle precio a su casa hasta cómo hacer una oferta o negociar reparaciones o concesiones. Y por eso, el conocimiento local de un agente importa hoy más que nunca.
Su plan tiene que basarse en su vecindario, y solo un agente tiene la experiencia para hacerlo bien.
En resumen
Este mercado no es igual para todos.
Si se pregunta quién tiene la ventaja donde vivimos, hablemos. Le mostraré exactamente cómo se ven los números en nuestro mercado, y qué estrategia le brinda la mejor oportunidad de conseguir lo que desea.
Gracias Por Leer,
Denise Olivares-Molina

by Denise Olivares-Molina | Aug 17, 2026 | Advice for Buyers, Buyers, First Time Home Buyers, First-Time Buyers, First-Time Investors, For Buyers, Market Trends, Market Updates, Real Estate Finances, Real Estate Goals, Real Estate Investing, Real Estate Market, Real Estate Market 2026, Real Estate Tips, Real Estate Trends in 2026, Weekly
Ask around and almost every homebuyer out there wants to know if there’s a way to get a better deal. And just about every seller wants to know if they’ll still get top dollar.
The interesting thing is… both can be right at the exact same time. It just depends on where you live.
That’s because today’s housing market isn’t moving in one direction anymore. Some markets clearly favor buyers. Others still favor sellers. But most are sitting somewhere in the middle.
And knowing which market you’re actually in can completely change the strategy you use to buy or sell (and what expectations you should have). Let’s break it down.
One Number Tells You Who’s Got Leverage
So how do you know which market you’re in? There’s one number that tells the story faster than anything else: the months’ supply of homes for sale. It’s the clearest signal of who’s got leverage – and what strategy you’ll need. Think of it like this.
Imagine no additional homes were listed starting today. Months’ supply tells us how long it would take to sell everything that’s currently on the market based on today’s demand.
Generally speaking, if months’ supply is:
-
Fewer than 4 months: Sellers usually have the advantage.
-
4 to 6 months: Buyers and sellers are on more equal footing.
-
More than 6 months: Buyers can usually negotiate for a better deal.
Right now, the National Association of Realtors (NAR) data says that number is 4.6 and that puts the overall market back in balanced territory (see graph below):
That means, as a whole, the market has finally moved back into a much more balanced range after years of being tilted in sellers’ favor. While that may look like the scales have tipped only slightly, it’s enough to make a real difference in what strategy you’ll need for your move – at least in most places.
The Tale of Two Markets: Why ‘Balanced’ Doesn’t Mean the Same Thing Everywhere
Redfin data helps shed some light on how this shakes out across the country. It breaks down which cities are leaning in either direction (see graph below).
-
Some markets give buyers more leverage.Those are in blue.
-
Some still favor sellers. That’s the orange.
-
Others fall somewhere in between. Those are gray.
Notice anything? A lot more places are seeing more buyer-friendly conditions right now. In fact, this is the most buyer-friendly market we’ve seen in nearly 6 years.
But don’t take that as buyers have the upper hand everywhere.
There are still cities where sellers still have the power. And if you’re in one of them, your approach to selling or buying looks completely different than it would in a buyer-leaning market.
The Biggest Mistake You Can Make Right Now
That’s why the biggest mistake isn’t thinking it’s finally a buyer’s market. And it isn’t thinking it’s still a seller’s market either. It’s making any assumption without talking to an expert agent first.
Today’s market is incredibly local. In one market, a buyer may be getting thousands of dollars in concessions from a seller. And a homeowner may have to consider dropping their price.
But in another, a buyer may be stressed about coming in with their best offer, or they may lose out on the home to another buyer. And a seller may still be seeing strong demand and prices inching higher.
Same overall housing market.
Very different experiences.
The truth is what’s happening in your back yard affects everything from pricing your house to making an offer to negotiating repairs or concessions. And that’s why an agent’s local knowledge matters more now than ever before.
Your plan has to be based on your neighborhood – and only an agent has the expertise to get that right.
Bottom Line
This market isn’t one-size-fits-all.
If you’re wondering who has the upper hand where we live, let’s talk. I’ll show you exactly what the numbers look like in our market – and what strategy gives you the best shot at getting what you want.
Thank You For Reading
Denise Olivares-Molina

by Denise Olivares-Molina | Aug 3, 2026 | Advice for Sellers, For Sellers, Home Gain Statistics, Home Prices, Homeowner Information, Housing Market, Housing Market Insights, Housing Market Shifts, Housing Market Updates, Market Updates, Pricing, Real Estate Finances, Real Estate Goals, Real Estate Investing, Real Estate Market, Real Estate Market 2026, Real Estate Myths, Weekly
After more than a year of headlines talking about how home prices are going to crash, the latest data shows that price growth may be starting to pick back up again. And depending on whether you’re buying or selling, that shift means something different for you.
The Numbers May Be Starting To Turn
For the past couple of years, home price growth has been moderating – cooling from around 7% in mid-2024, according to Redfin (see graph below). But look at the right side of that graph. The pace of that growth appears to have hit its low point and started to turn.
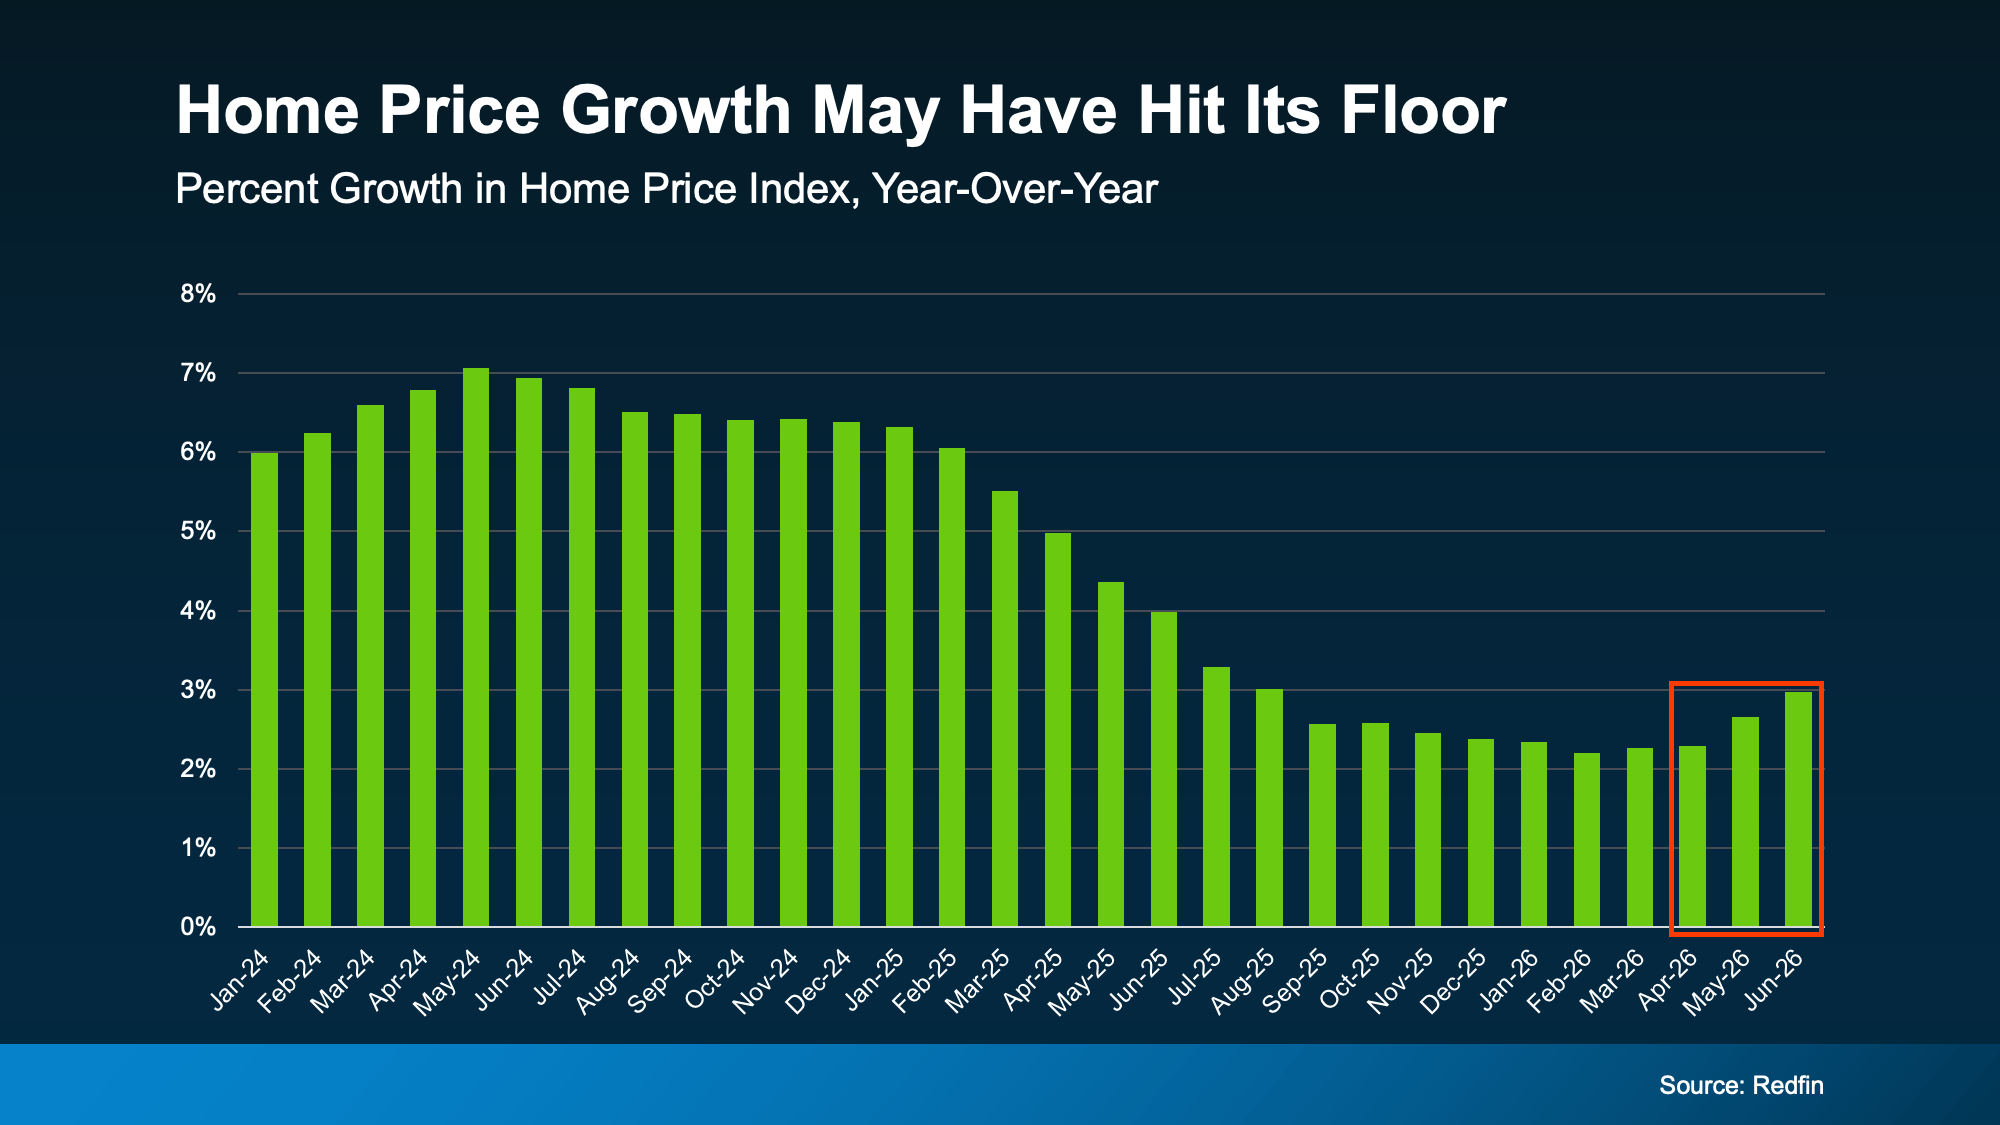
While a couple months of data doesn’t necessarily mean this will be a lasting trend, there are some other signs that this could continue.
For example, fewer markets are seeing prices decline. According to ResiClub and Zillow, about 36% of the 300 largest housing markets had falling prices as of the middle of last year. Since the start of this year, that share has been shrinking. Now? Only 23% are experiencing those mild dips (see graph below):
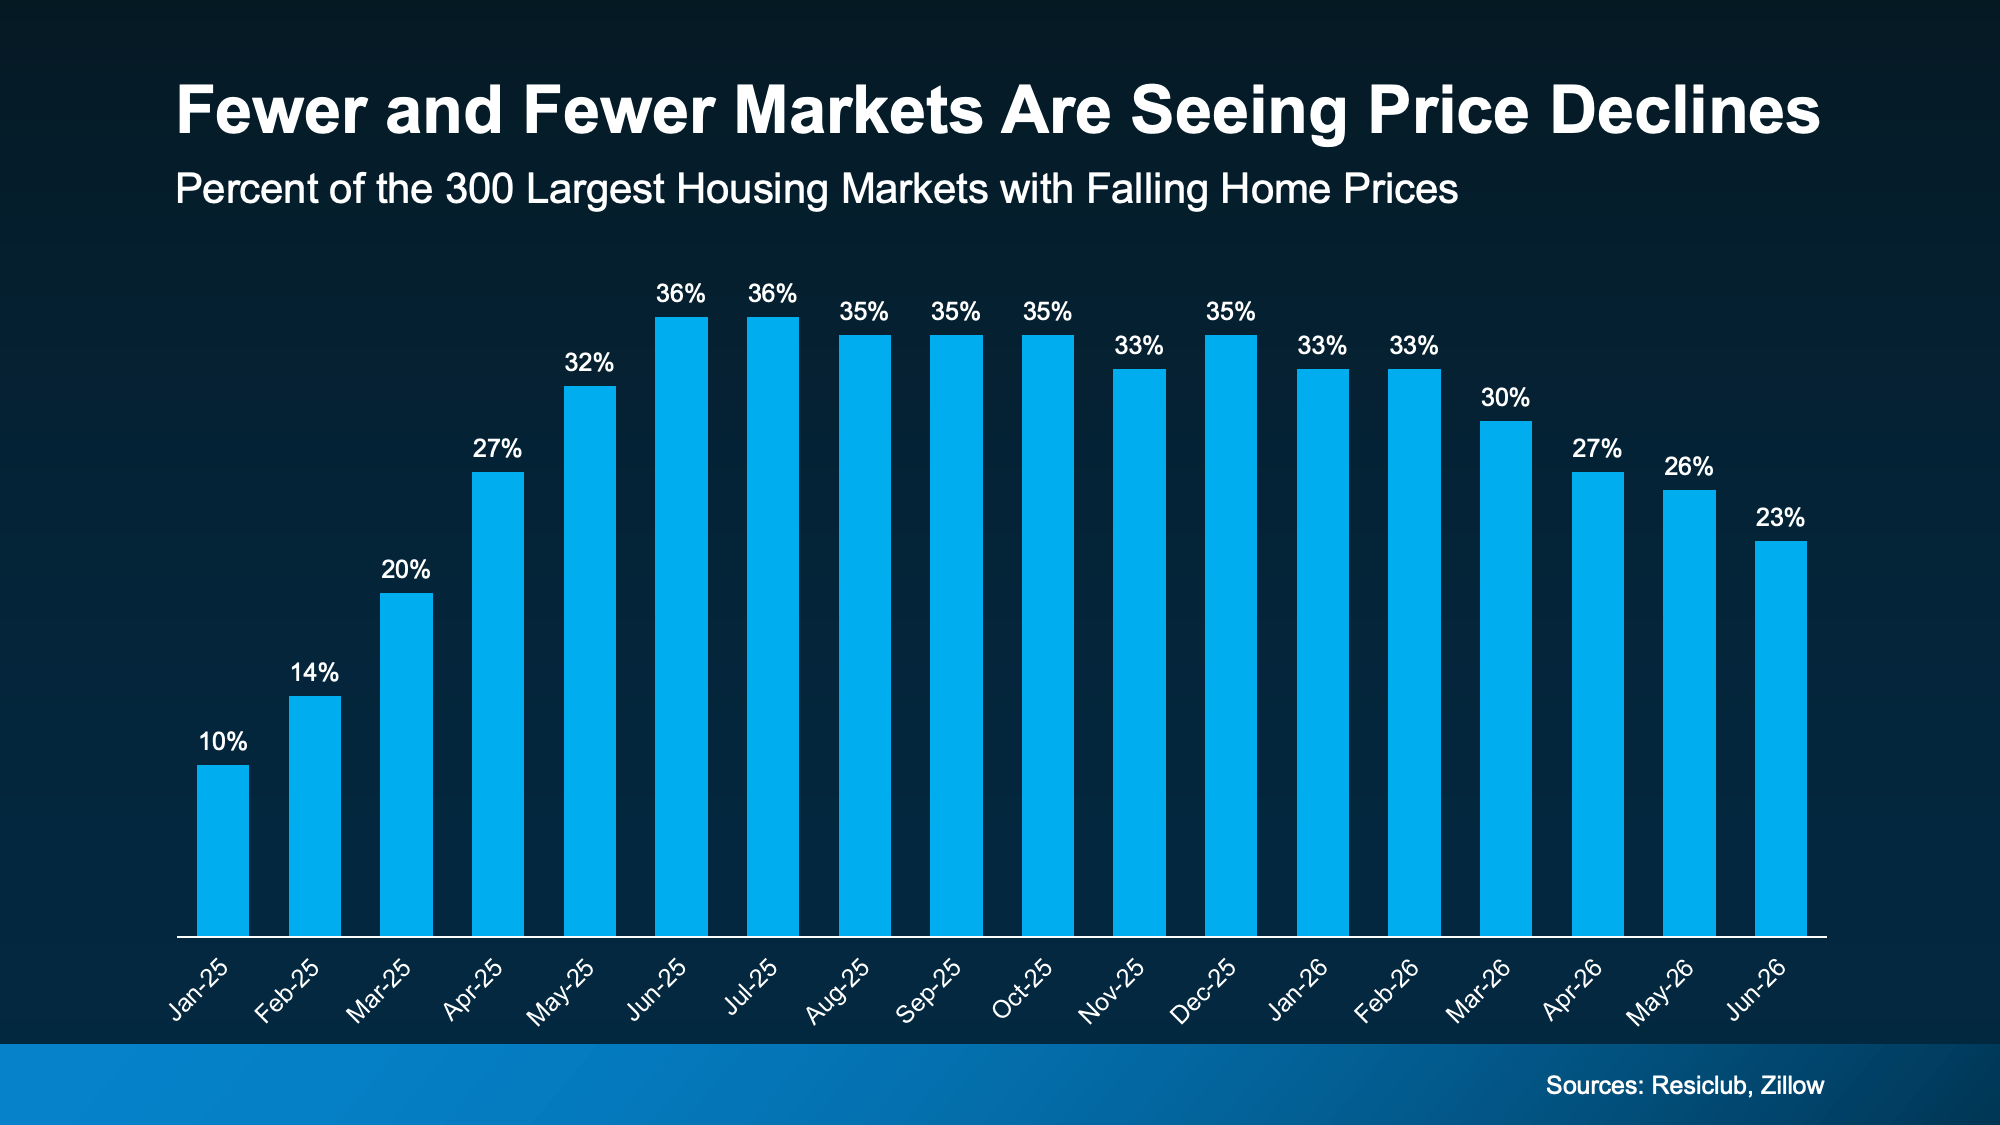
When fewer markets see prices falling, that means more markets are seeing prices rise again.
And forecasts suggest this shift has room to run. On average, experts project home prices will rise about 2.3% nationally this year. And for that to happen, price growth would have to pick up a bit in the second half of 2026.
But Remember, Real Estate Is Local
While it looks like national prices may be starting to pick back up a tiny bit, that doesn’t mean that’s what’s happening in your neighborhood.
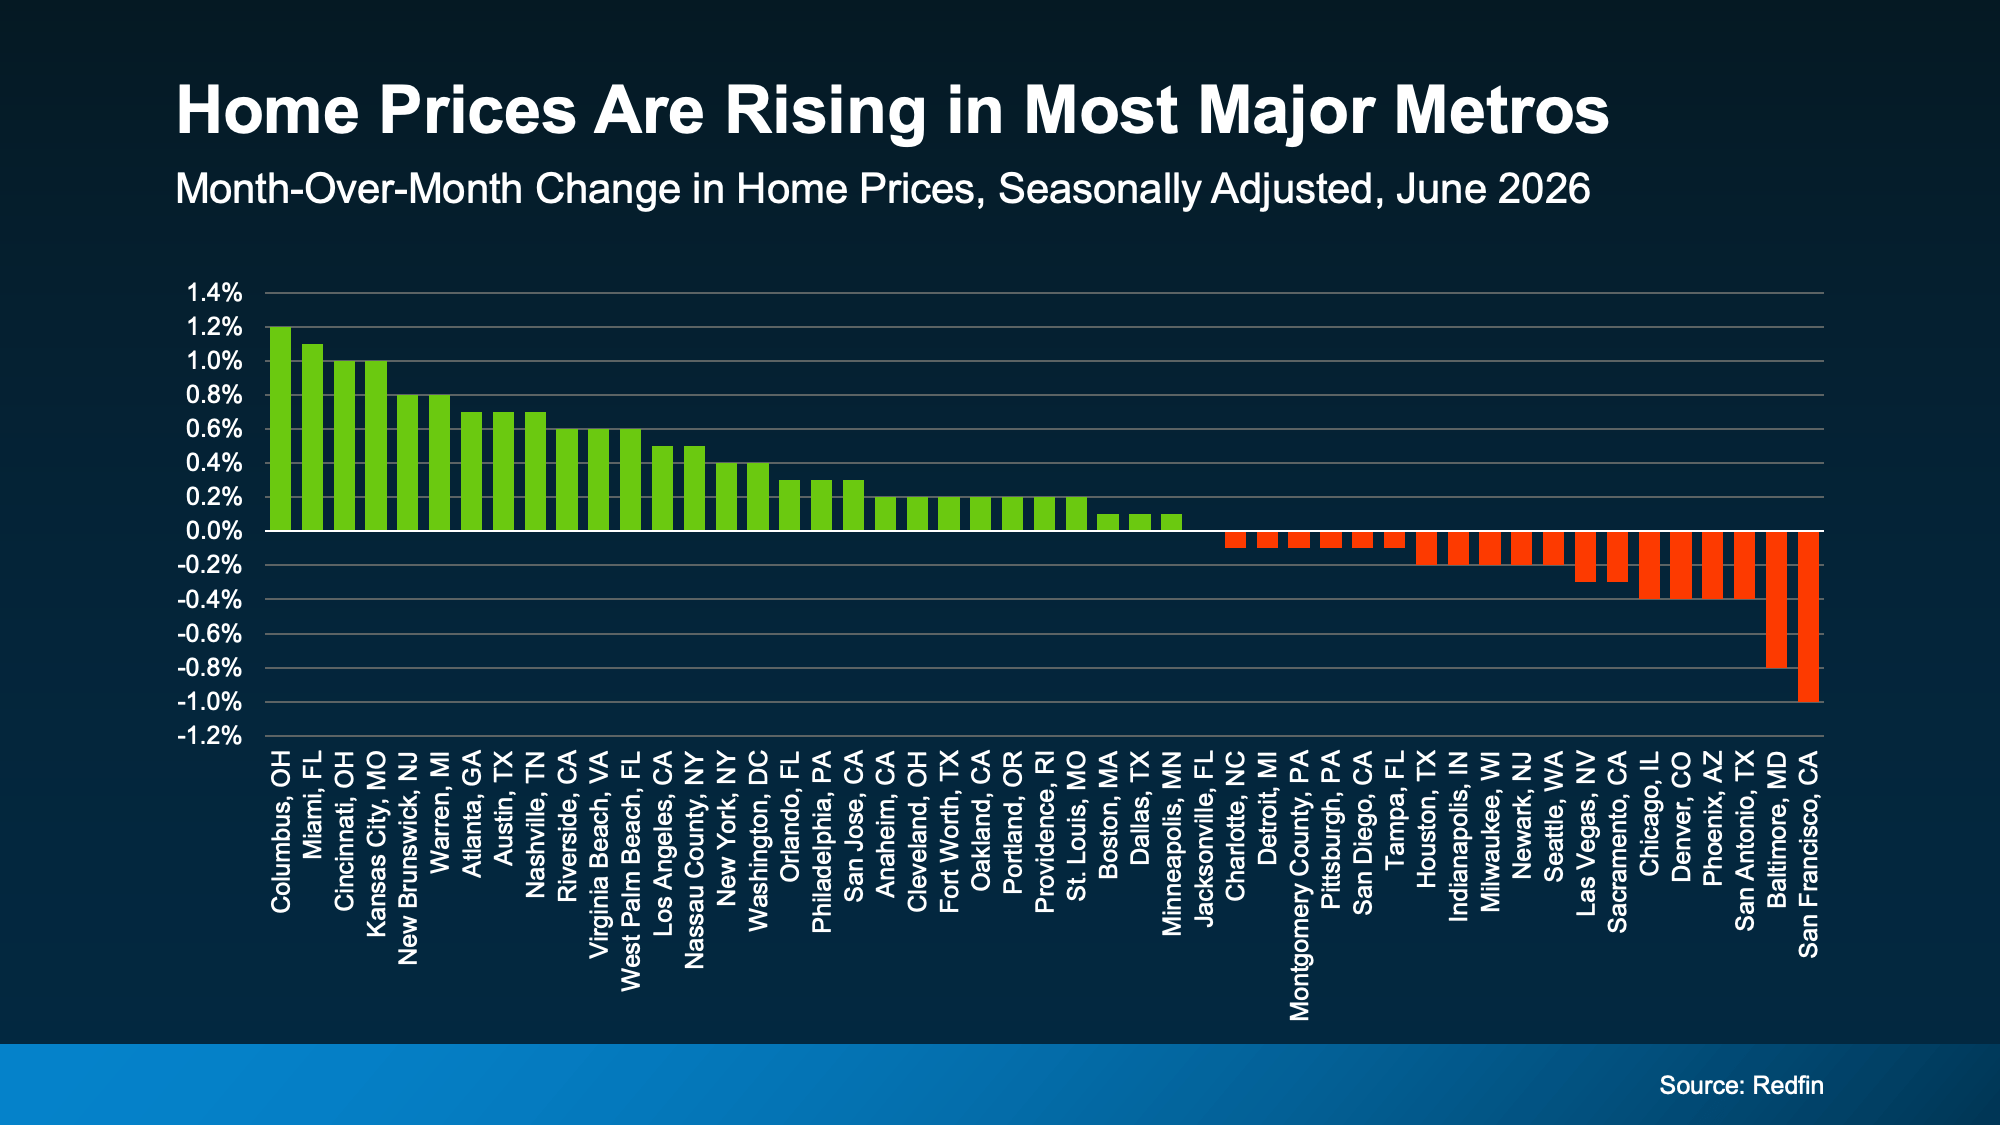
National home prices are really just an average of hundreds of local markets. Some are climbing faster. Others are still cooling. But one reason the national average may be looking up is because a growing number of metros may actually be net positive for prices this year.
Not long ago, the major metros were split about 50/50 – half seeing prices rise and half seeing them fall. Now, that balance looks like it’s starting to tip in a more positive direction. Just last month, more than half of the major metros saw prices go up, according to Redfin (see graph below):
As Selma Hepp, Chief Economist at Cotality, explains:
“. . . local markets continue to tell very different stories. Annual home price growth has changed little since the start of the year, but some markets, especially those supported by strong job and income growth in the West and more affordable Midwest markets, have seen notable acceleration in price gains.”
What This Means for You
Home price headlines can be confusing because they don’t always tell the full picture. Lean on an agent to understand what’s happening in your local market and what the early signs say for where prices may go from here.
That’s the best way to stay one step ahead of the market.
If you’re buying: slower price growth has worked in your favor. You’ve had more room to negotiate and a budget you could plan around. If price growth is picking up in your area, buying now may mean paying less than you would later this year.
If you own a home: you’ve been gaining equity all along, even while growth moderated. If growth keeps picking up, those gains could speed up, too. Lawrence Yun, Chief Economist at the National Association of Realtors (NAR), projects the typical homeowner will gain roughly $16,000 in housing wealth this year. And if you’re thinking about selling, this shift is a good early sign for you. Just remember, the market is still pretty balanced and buyer-friendly in a lot of areas right now.
Home price growth slowed way down, and now it’s showing early signs of picking back up. Whether you’re buying or selling, let’s connect so you can see exactly what prices are doing in our local market and what that means for your plans.
Bottom Line
Home price growth slowed way down, and now it’s showing early signs of picking back up. Whether you’re buying or selling, let’s connect so you can see exactly what prices are doing in our local market and what that means for your plans.
Thank You For Reading
Denise Olivares-Molina

by Denise Olivares-Molina | Jul 20, 2026 | Advice for Buyers, Buyers, Buying A Home, Buying Myths, Buying Tips, Economy, Elegant Designs, Housing Market, Housing Market Insights, Housing Market Shifts, Housing Market Updates, Infographic, Market Trends, Market Updates, Real Estate Finances, Real Estate Goals, Real Estate Investing, Real Estate Market, Real Estate Market 2026, Real Estate Trends in 2026, Recipes, Weekly
If you’ve thought about buying a home in the past few years, you may have run into two frustrations: asking prices that kept climbing and too few homes to choose from.
In many places, both sticking points are letting up this summer, with lower asking prices and more homes for sale. Let’s look at the trends, and what they mean for your search.
Sellers Are Pricing To Attract Buyers
According to Realtor.com, the national median asking price was $430,000 in June, nearly $11,000 under what it was the year before (see graph below):
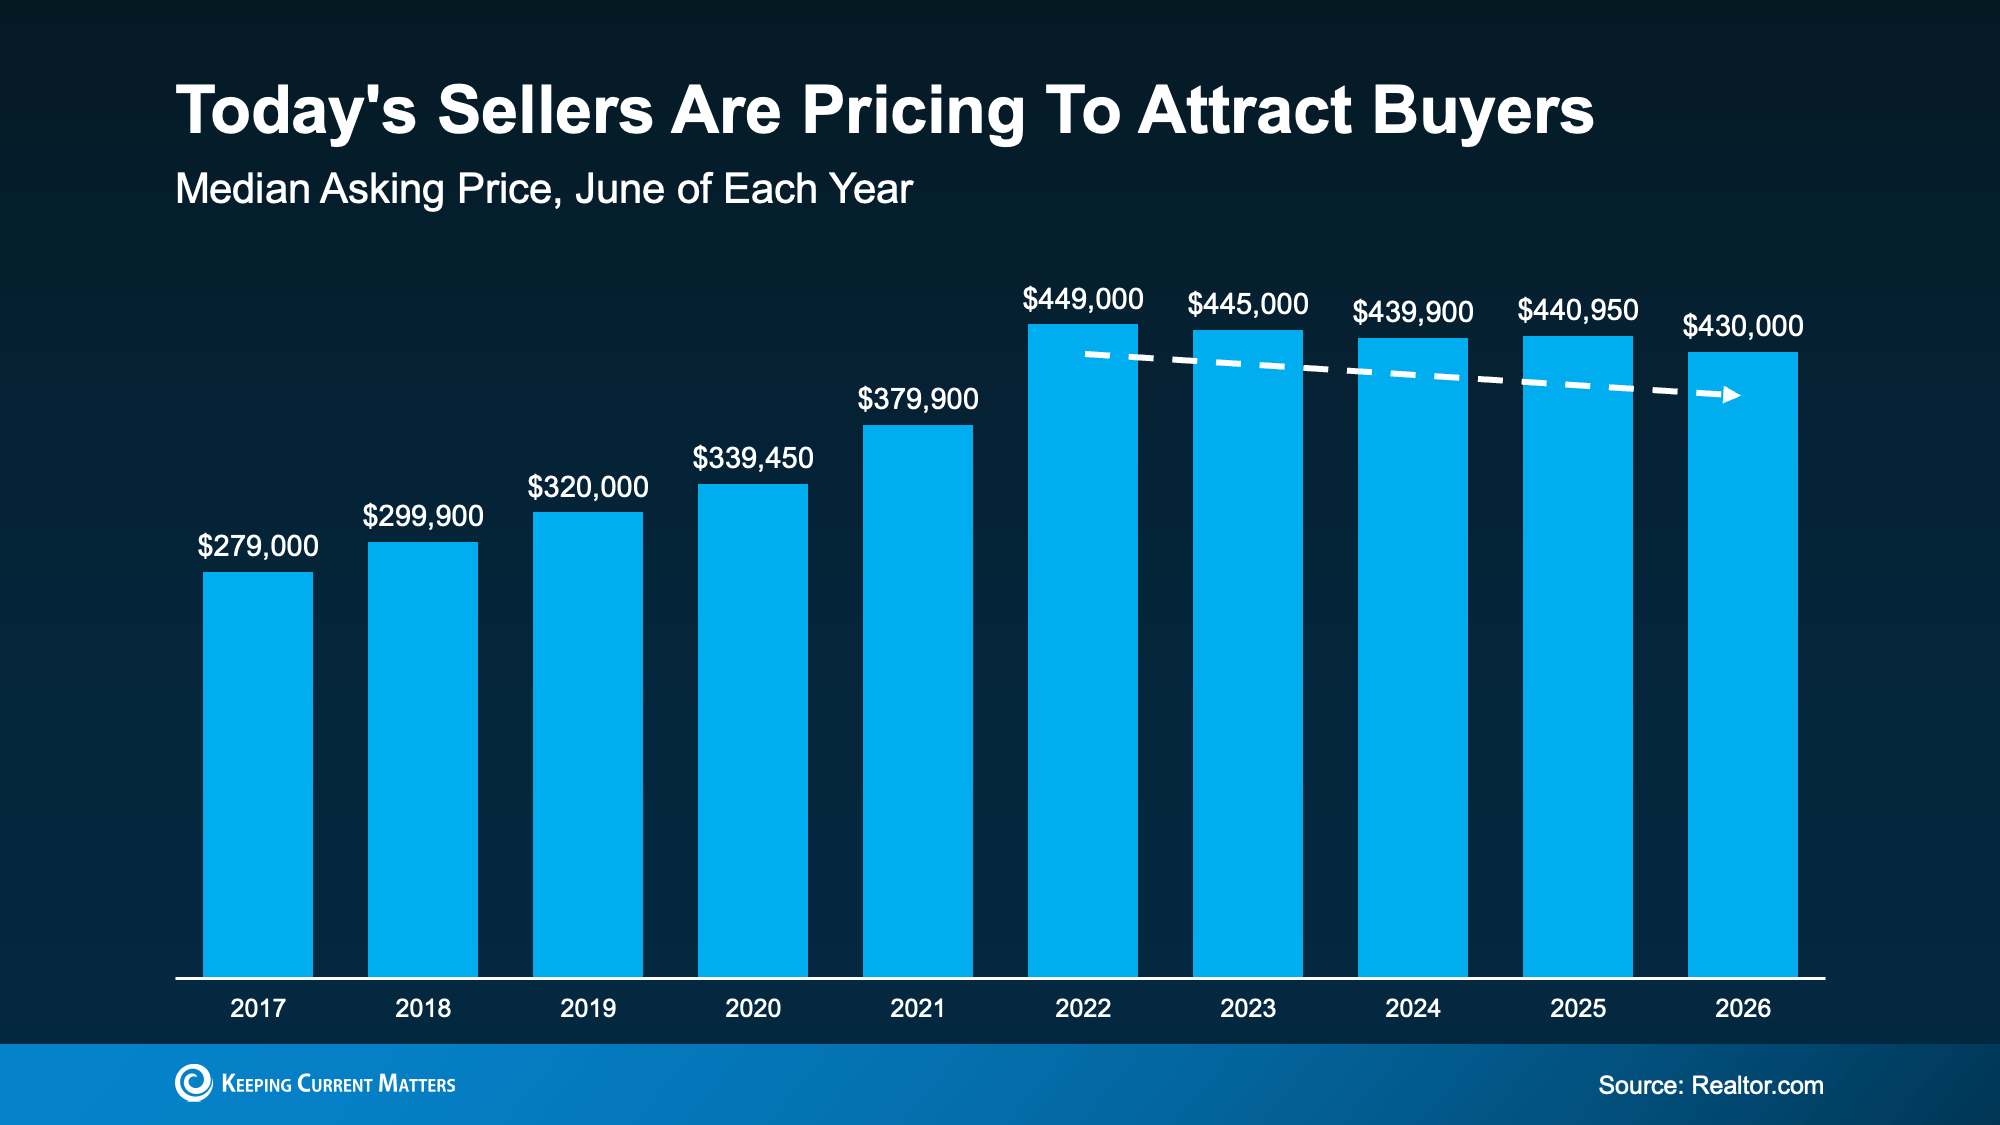
That’s the eighth month in a row that the typical asking price has dipped below where they were the previous year, according to the same Realtor.com report.
And while falling prices can sound worrying, this isn’t a sign of an impending crash. We’re talking about asking prices, not sold prices. This is a sign that today’s sellers are meeting the market where it is and pricing to draw buyers. And that’s actually something normal we’d expect from the market. As Danielle Hale, Chief Economist at Realtor.com, puts it:
“Sellers are reading market conditions and are pricing accordingly from the start rather than listing high and cutting later, and buyers are taking note and making bids. This is a welcome sign that we are in a functioning market.”
Asking prices were never going to climb forever – now they’re just settling closer to what buyers can actually pay. That signals a healthier market, and sellers re-adjusting their expectations.
More Homes Are Available Now
If you’ve spent the past few years watching homes disappear before you could even schedule a tour, this is for you.
Supply is starting to catch up. According to Realtor.com, the number of homes listed for sale in June was the highest June number we’ve seen in three years (see graph below):
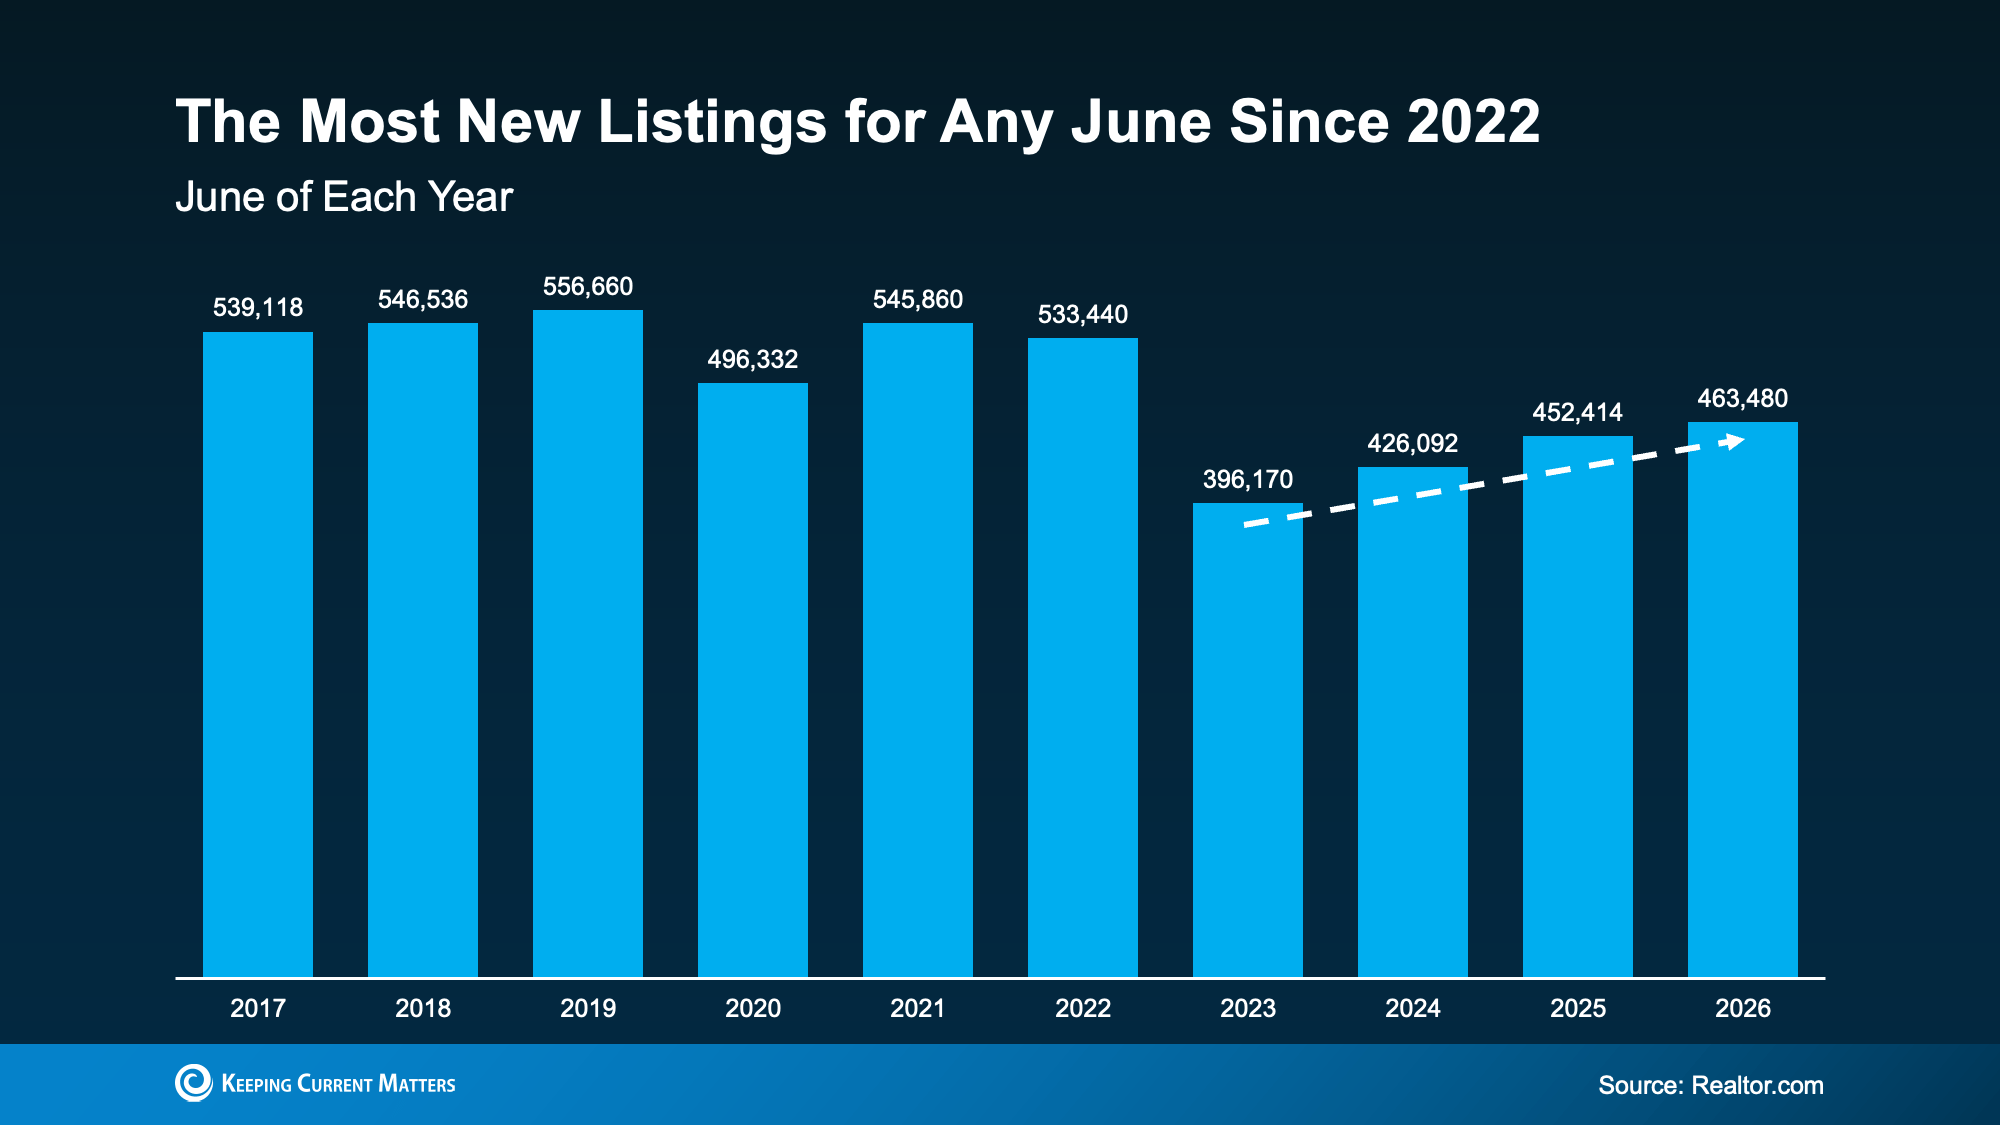
This means more options for you and less competition for each one.
Now, supply is not back to normal everywhere. As you can see, we’re still down from where we were back in 2017-2019. But in many places, it’s better than it’s been in a while. Here’s how that helps you.
You don’t have to rush an offer just to stay in the running, and you have better odds of finding and landing the right home, not just the one that’s available. Plus, you’ll have more room to negotiate, so you’re searching from a stronger position than buyers had even a year ago.
Why This Is Encouraging if You’re Buying Your First Home
For first-time buyers looking for lower-priced homes, these trends line up especially well. Mischa Fisher, Chief Economist at Zillow, explains:
“The lowest price tiers are exhibiting some softness in terms of price, they also had the most listing-activity growth, the first time since 2022 that’s been the case.”
So, if you’re searching for your first place or your next house, there’s a little more to choose from and a little more give on price.
Bottom Line
If a tight budget or a thin selection has kept you from buying a home, now might be the time to restart your search.
Ready to see what’s available here? Let’s connect.
Thank You For Reading,
Denise Olivares-Molina

by Denise Olivares-Molina | Jun 1, 2026 | Advice for Sellers, Family Time, For Sellers, Move-up Buyers, Moving On, Real Estate Finances, Real Estate Goals, Real Estate Investing, Real Estate Market, Real Estate Market 2026, Real Estate Tips, Real Estate Trends in 2026, Seller, Sellers, Selling A Home, Selling Tips
You may be telling yourself you’re going to wait to move – maybe you’re hoping mortgage rates will come down, prices will fall, or the market will feel a little easier.
And honestly? A lot of people feel that way right now. But here’s what some are starting to realize.
Waiting doesn’t usually fix the thing that made you want to move in the first place.
Your family still desperately needs more room. Your empty nest still feels too…empty.
Your parents or grandparents still need you to live closer.
You just got married… or divorced.
Your vision of retirement has you living somewhere else.
Eventually, life can reach a point where waiting feels harder than moving.
That’s why some people are still deciding to buy right now, even in today’s market. Not because conditions are perfect. But because the life changes behind their move never really went away.
And maybe that’s exactly where you are too. If so, you’re certainly not alone.
The Real Reasons People Move
Data from the National Association of Realtors (NAR) shows 1 in 5 buyers last year said they felt like they had to purchase a home at that time, no matter the market.
That’s an important reminder right now. Sure, the dollars and cents of your move have to make sense for you. But big life changes happen whether mortgage rates and home prices are high, low, or somewhere in between.
And those big life events happen more than you may think. NAR says roughly 22.5 million people experience major life changes in a typical two-year span (see graph below):

These are exactly the kinds of things that can change how much space you need, where you want to live, or what kind of lifestyle makes sense now. Chen Zhao, Head of Economics Research at Redfin, explains:
“Life doesn’t stand still—people get new jobs, grow their families, downsize after retirement, or simply want to live in a different neighborhood.”
And that’s what makes waiting so hard. Every month you spend hoping the market changes is another month living in a house that no longer works for your life. It’s stressful to feel stuck. And that feeling usually doesn’t disappear.
There May Be More Opportunity Than You Think
But while affordability is still a challenge, there may still be a way for you to make your move.
The number of homes for sale has been growing for 4 straight years (see graph below). That means more homes to choose from and, in some markets, more room to negotiate than buyers had just a few years ago.
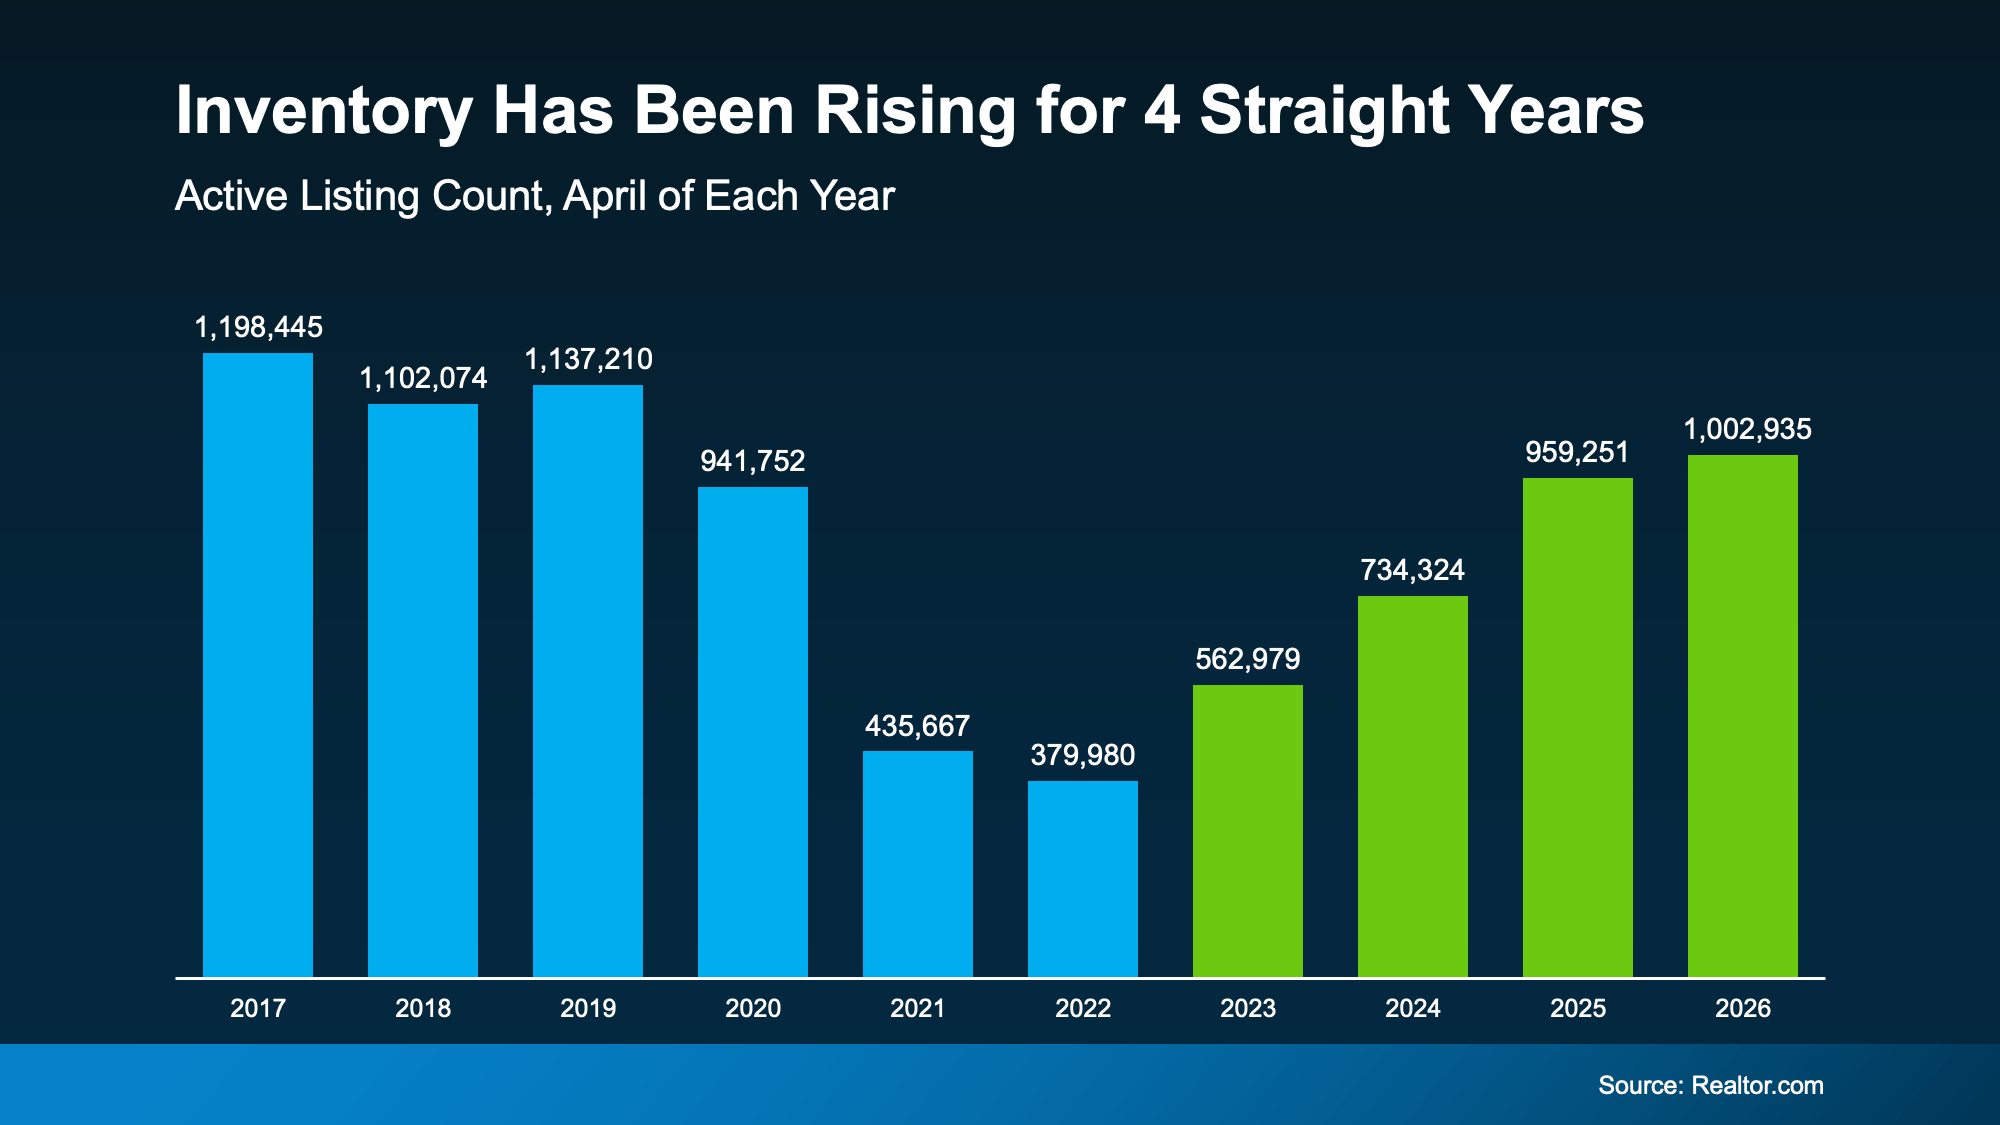
That doesn’t mean moving is suddenly easy. But it does mean some buyers are finding ways to make a move work. So, if you’ve been putting your plans on hold, maybe the question isn’t just:
“What’s the market doing?” or “When will it get better?”
Maybe ask yourself this, too: “Can I still live where I’m at right now and make it work?”
If the answer to that second question is “no,” it may be worth having a conversation about what your options look like today – despite where rates or prices are. You could find your move is still possible after all. With more homes for sale, there’s a better chance to find one that fits your life (and your budget) right now.
Bottom Line
Life changes. Priorities shift. Families grow. Kids move out. Careers evolve. And eventually, the house you’re in may stop fitting the life you’re living.
If that’s been weighing on you lately, let’s talk through what your options could realistically look like today, no matter where rates or prices are.
Life can’t always wait for perfect market conditions. Maybe you don’t have to either.
Thank you For Reading
Denise Olivares-Molina
